Experiment Chart Configuration
Customize the charts displayed in an experiment's Dashboard tab by creating a .dashrc file inside the experiment folder.
Creating and Editing .dashrc
If no .dashrc exists yet, click the save icon (tooltip Save current dashboard view as .dashrc) in the Dashboard tab toolbar. This generates a default configuration based on the current auto-generated charts, which you can then edit.
To edit an existing .dashrc:
- Click the edit icon (tooltip Edit .dashrc) in the top-right of the Dashboard tab, or click the
.dashrcfile. - A split view opens: YAML editor on the right, live chart preview on the left.
- Edit — charts update automatically.
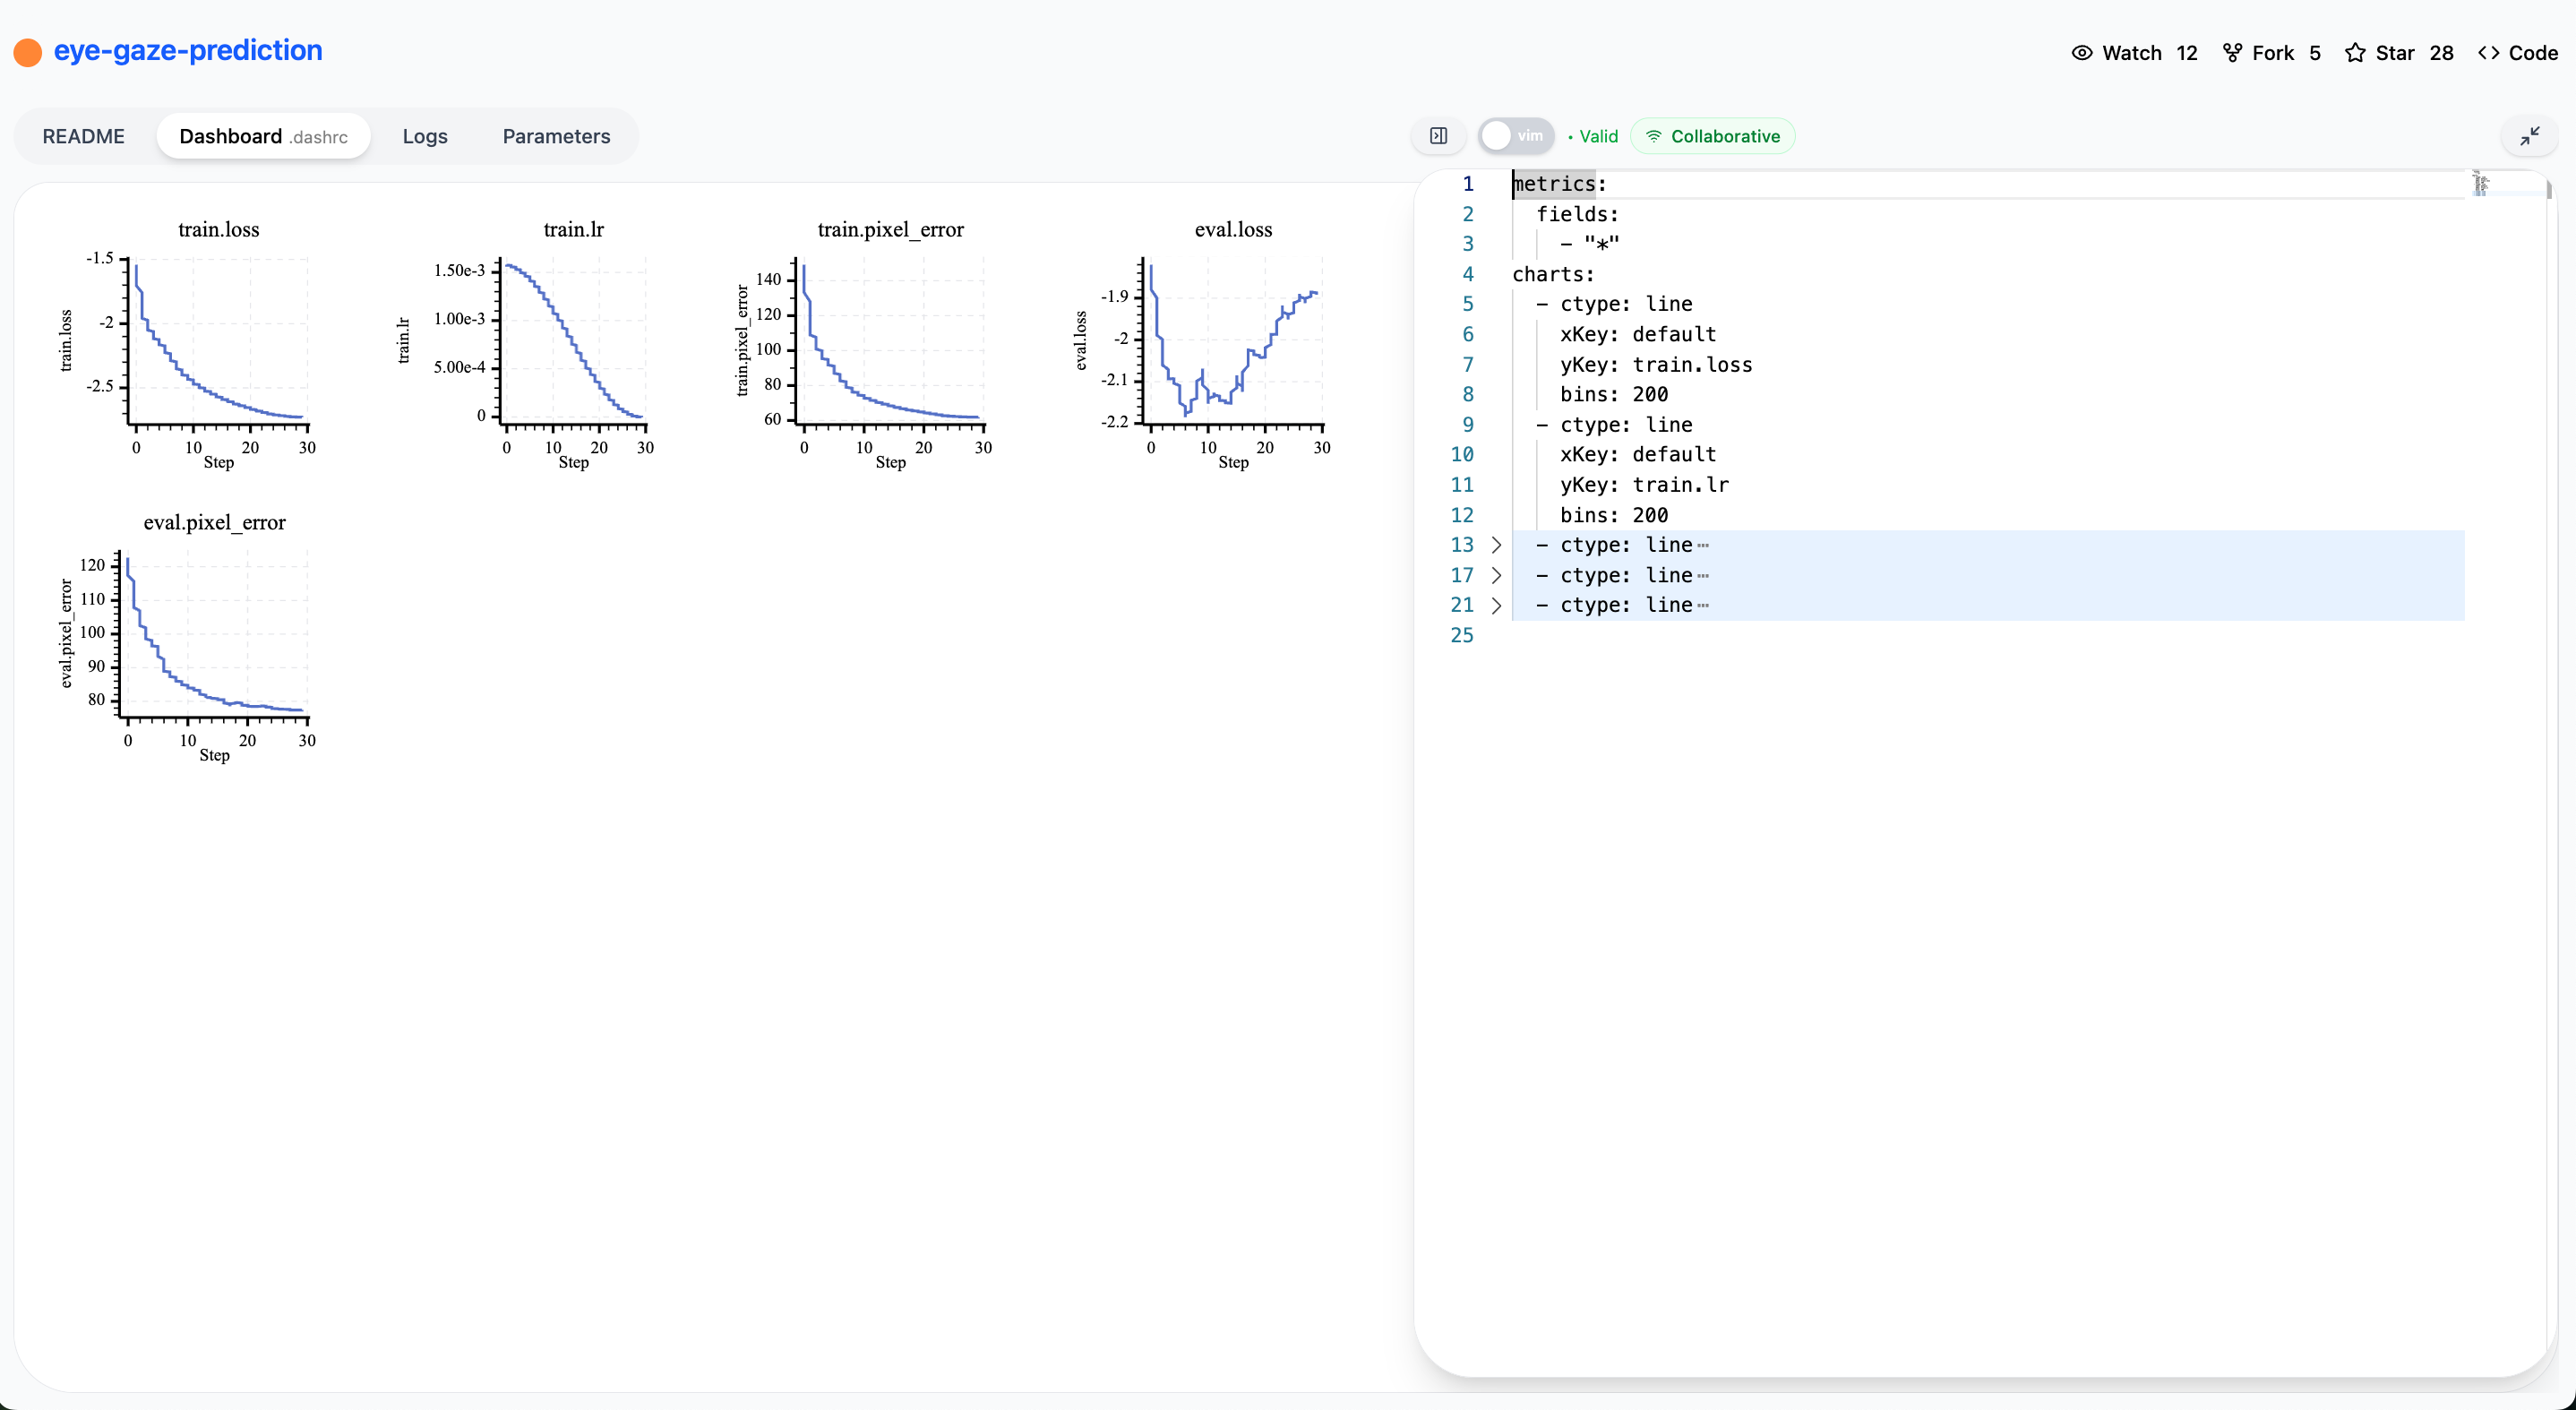
The .dashrc editor: YAML editor on the right with live chart preview on the left. Charts re-render automatically as you edit.
metrics — Header Metrics Filter
Controls which metrics appear in the experiment header, displayed as a row of key-value pairs above the charts.
| Field | Type | Default | Description |
|---|---|---|---|
fields | string[] | ["*"] | Glob patterns to filter which metrics are shown in the header |
Line Charts (ctype: line)
Line charts display time-series metrics tracked with exp.metrics().
Minimal Example
Full Example
Field Reference
| Field | Type | Default | Description |
|---|---|---|---|
ctype | "line" | — | Chart type (required) |
title | string | metric name | Chart title shown above the chart |
xKey | string | — | Metric name for the x-axis (required). Use "default" to let the server pick one, see below |
yKey | string | — | Single y-axis metric. Mutually exclusive with yKeys |
yKeys | string[] | — | Multiple y-axis metrics on the same chart. Mutually exclusive with yKey |
xLabel | string | xKey value | X-axis label |
yLabel | string | metric name | Y-axis label |
bins | number | 1000 | Number of points to downsample to. Higher values show more detail but are slower to render |
xFormat | string | null | null | Format specifier for x-axis tick labels |
yFormat | string | null | null | Format specifier for y-axis tick labels |
xTicks | number | auto | Number of grid ticks on the x-axis |
yTicks | number | auto | Number of grid ticks on the y-axis |
yKey vs yKeys
Use yKey for a single metric:
Use yKeys to plot multiple metrics on the same chart:
xKey: "default"
When xKey is set to "default", the server picks the x-axis from the metric's own fields, in this order:
stepepoch
If the metric has neither, the data index (the order points were logged in) is used. To plot against wall-clock time, set xKey: timestamp explicitly.
Image Charts (ctype: image)
Image charts display image files uploaded with exp.files().save_image() or any image artifact.
Example
Field Reference
| Field | Type | Default | Description |
|---|---|---|---|
ctype | "image" | — | Chart type (required) |
title | string | "Images" | Title shown above the grid |
glob | string | "**/*.{png,jpg,jpeg,gif,webp}" | Glob pattern to match image files within the experiment folder |
nCols | number | 3 | Number of columns in the image grid |
nRows | number | 2 | Number of rows in the image grid. The grid shows at most nCols × nRows images |
sort | "name" | "date" | "size" | "name" | Sort order for matched files |
Video Charts (ctype: video)
Video charts display video files uploaded with exp.files().save_video() or any video artifact.
Example
Field Reference
| Field | Type | Default | Description |
|---|---|---|---|
ctype | "video" | — | Chart type (required) |
title | string | "Videos" | Title shown above the grid |
glob | string | "**/*.{mp4,webm,mov}" | Glob pattern to match video files within the experiment folder |
nCols | number | 3 | Number of columns in the video grid |
nRows | number | 2 | Number of rows in the video grid. The grid shows at most nCols × nRows videos |
sort | "name" | "date" | "size" | "name" | Sort order for matched files |
Complete Example
Next: Learn how to compare multiple experiments with Compare.