Dashboard
The ML-Dash Dashboard is a web interface for browsing experiments, viewing metrics, and comparing runs. It is available at dash.ml.
Layout
The Dashboard uses a three-column layout:
- Left column — Namespace and project navigator. Browse your namespaces and projects.
- Middle column — File tree (top) and experiment list (bottom). Browse folders and experiments within the selected project.
- Right column — Content view. Displays tabs relevant to whatever is selected.
The left column has a fixed width and can be collapsed. The divider between the middle and right columns can be dragged. The right column can be expanded to fullscreen, which hides the other two.
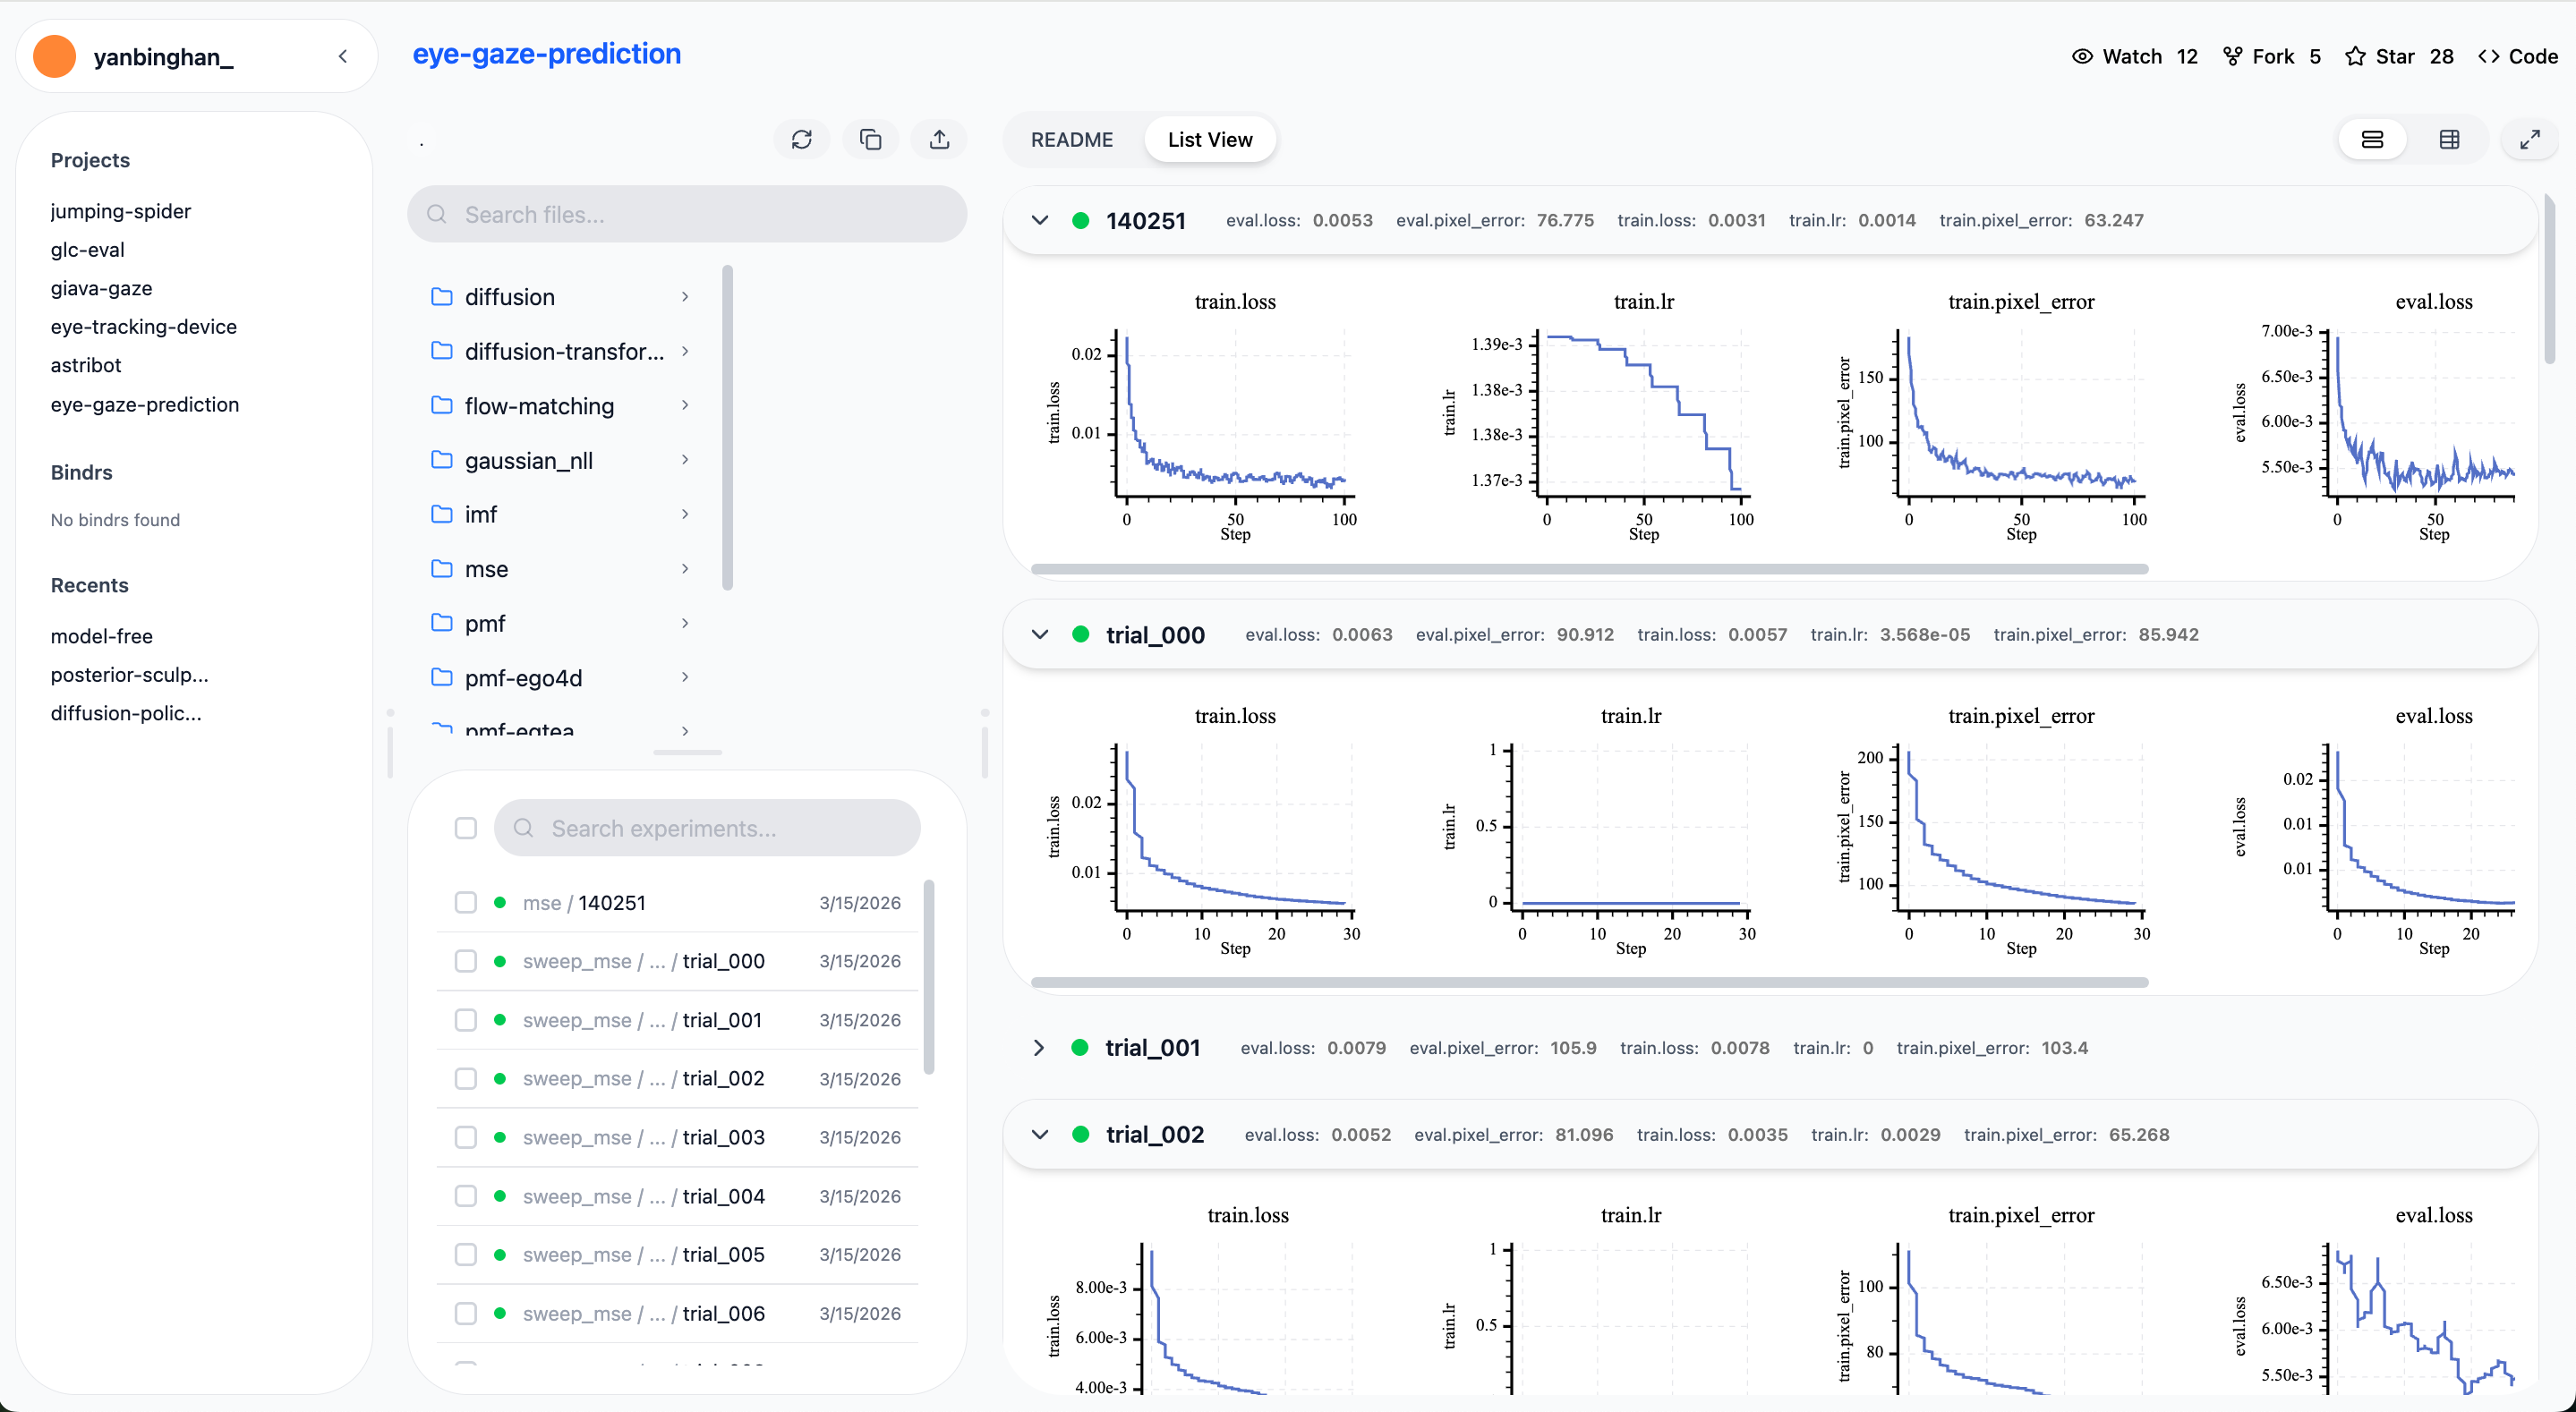
The three-column layout: namespace/project navigator (left), file tree and experiment list (middle), content tabs (right).
Tabs: Folder View
When a folder is selected (no experiment highlighted), the right panel shows:
| Tab | Shown when | Description |
|---|---|---|
| README | Always | Displays README.md if present in the current folder |
| List View | Always | Lists the experiments in the current folder, as rows or a grid |
| Compare | Folder contains .dashrc | Cross-experiment comparison charts (see Compare) |
| Live Compare | ≥ 2 experiments checked | Auto-generated comparison for the selected experiments |
Tabs: Experiment View
When an experiment is selected, the right panel shows:
| Tab | Description |
|---|---|
| README | Displays the experiment's README.md if present |
| Dashboard | Metric charts, image grids, and video players |
Additional tabs appear when a file is selected in the file tree:
| Tab | Shown when |
|---|---|
| Editor | An editable file (e.g. .dashrc, .yaml) is selected |
| Media | An image or video file is selected |
README Tab
Displays the experiment's README.md rendered as Markdown. If no README exists, the tab shows an empty state. Writing a README.md in your experiment folder is a good place to document what the experiment does and how to reproduce it.
Dashboard Tab
Displays charts for the experiment's tracked data. See the sections below for details.
Parameters and Logs
Parameters and logs don't have tabs of their own. Every experiment in the
List View has a params and a log chip. Click one to open an inline
panel under that experiment, and press Esc or click outside it to close it.
- params shows the hyperparameters recorded with
exp.params.set(), grouped by their dot-notation prefix.model.architectureandmodel.pretrainedappear together under model. - log shows the messages written with
exp.log(): timestamp, level, message, and metadata. Narrow it to a time range with the From / To fields.
See Parameters and Logs for the SDK side.
Dashboard Tab
Displays charts for the experiment's tracked data. See the sections below for details.
Logs Tab
Displays log messages written during the experiment with exp.log():
Each log entry shows its timestamp, severity level (debug / info / warn / error / fatal), message, and any attached metadata. You can filter logs by time range using the From / To fields at the top of the tab.
See Logging for the full API.
Parameters Tab
Displays the hyperparameters recorded with exp.params.set():
Parameters are shown as a searchable table, grouped by their dot-notation prefix. For example, model.architecture and model.pretrained appear together under a model group. Use the search box to filter by key name or value.
See Parameters for the full API.
Dashboard Tab
Default Behavior (No .dashrc)
When no .dashrc file exists in the experiment folder, the Dashboard automatically generates one chart per metric:
- Each metric gets its own line chart.
- The x-axis is
default, which the server resolves to the first of step → epoch that the metric has, and otherwise to the data index. - Each chart is downsampled to 200 points.
Customizing Charts
To customize which charts appear and how they look, create a .dashrc file in the experiment folder. The easiest way is the save icon (tooltip Save current dashboard view as .dashrc) in the Dashboard tab toolbar. It generates a default configuration file based on the current auto-generated charts, which you can then edit. See Experiment Chart Configuration for details.
Tab Auto-Switching
The right column switches tabs automatically as you navigate, following these rules:
When you select an experiment:
- If the experiment folder contains a
README.md→ switches to the README tab. - Otherwise → switches to the Dashboard tab.
When you select a folder (no experiment highlighted):
- If the folder contains a
.dashrcfile → switches to the Compare tab (takes priority over README). - If the folder contains a
README.md(and no.dashrc) → switches to the README tab. - Otherwise → stays on the List View tab.
When you select a file in the file tree:
.dashrcfile inside an experiment → Dashboard tab (with the editor open)..dashrcfile inside a folder → Compare tab (with the editor open).README.md→ README tab.- Image or video file → Media tab.
- Any other editable file (
.yaml,.json, etc.) → Editor tab.
Other automatic switches:
- Checking 2 or more experiments in the list → Live Compare tab appears (not automatically selected).
- Unchecking experiments below 2 → Live Compare tab disappears.
- Navigating away from an experiment → the experiment-only Dashboard tab is hidden.
Deep Links
The URL path determines which folder the file tree is focused on. Clicking a segment in the path header or the breadcrumb above the file tree navigates to that point and updates the URL.
You can deep-link directly to any folder by constructing the URL:
For example:
Opening this URL focuses the file tree at 2026/ablations inside rl-project. This is useful for sharing a link to a specific folder with teammates or bookmarking a frequently used experiment directory.